Basic Least Squares
|
1 2 3 4 |
library(UsingR); data(galton) plot(galton$parent,galton$child,pch=19,col="blue") lm1 <- lm(galton$child ~ galton$parent) lines(galton$parent,lm1$fitted,col="red",lwd=3) |
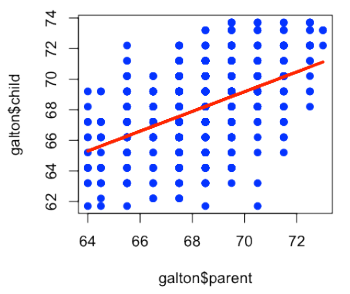
abline() - This function adds one or more straight lines through the current plot.
Inference Basics
|
1 |
sampleLm4$coeff |
|
1 2 |
(Intercept) sampleGalton4$parent 15.8632 0.7698 |
|
1 |
confint(sampleLm4,level=0.95) |
[crayon-663af642b43339720[......]