Data Analysis - Week 4

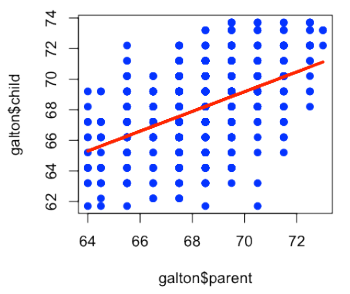
Basic Least Squares

fit a line

abline() - This function adds one or more straight lines through the current plot.

Inference Basics

[crayon-663b8b1bf2f837720[......]

阅读全文 »

Data Analysis - Week 3

一、Exploratory Graphs
  • boxplot() - Produce box-and-whisker plot(s) of the given (grouped) values. Parameter formula such as y ~ grp means y is a numeric vector of data values to be split into groups according to the grouping variable grp (usually a factor).
  • barplot(height, ...) - Creates a bar pl[......]

    阅读全文 »

Data Analysis - Week 2

一、Steps in a Data Analysis
  1. Define the question
  2. Define the ideal data set
  3. Determine what data you can access
  4. Obtain the data
  5. Clean the data
  6. Exploratory data analysis
  7. Statistical prediction/modeling
  8. Interpret results
  9. Challenge results
  10. Synthesize/write up results
  11. Create reproducible code
  12. [......]

    阅读全文 »

Data Analysis - Week 1

1月22日开始的Coursera课程Data Analysis第一周中介绍了一个网站OpenIntro[1],上面有一本免费的统计学教科书OpenIntro Statistics和概率分布表。

参考:
[1] http://www.openintro.org/index.php

[......]

阅读全文 »