一、Exploratory Graphs
- boxplot() - Produce box-and-whisker plot(s) of the given (grouped) values. Parameter formula such as y ~ grp means y is a numeric vector of data values to be split into groups according to the grouping variable grp (usually a factor).
- barplot(height, ...) - Creates a bar plot with vertical or horizontal bars.
- hist(x, ...) - Computes a histogram of the given data values.
|
1 2 |
dens <- density(pDtata$AGEP) plot(dens, lwd=3, col="blue") |
- plot() - For more details about the graphical parameter arguments, see ?par.
- hexbin{hexbin}
- qqplot() - Produces a QQ plot of two datasets.
- matplot() - Plot the columns of one matrix against the columns of another.
二、Expository Graphs
xlab, ylab, main, legend
- par(mfrow=c(1,2)) - A vector of the form c(nr, nc). Subsequent figures will be drawn in an nr-by-nc array on the device by columns (mfcol), or rows (mfrow), respectively.
- mtext(text="(a)",side=3,line=1) - Text is written in one of the four margins of the current figure region or one of the outer margins of the device region. (side: 1=bottom, 2=left, 3=top, 4=right; line: on which MARgin line, starting at 0 counting outwards.)
Saving files in R is done with graphics devices. Use the command ?Devices to see a list.
|
1 2 3 4 5 6 7 8 |
png(file="twoPanel.png",height=480,width=(2*480)) par(mfrow=c(1,2)) hist(pData$JWMNP,xlab="CT (min)",col="blue",breaks=100,main="") mtext(text="(a)",side=3,line=1) plot(pData$JWMNP,pData$WAGP,pch=19,cex=0.5,xlab="CT (min)",ylab="Wages (dollars)",col=pData$SEX) legend(100,200000,legend=c("men","women"),col=c("black","red"),pch=c(19,19),cex=c(0.5,0.5)) mtext(text="(b)",side=3,line=1) dev.off() |
The top ten worst graphs: http://goo.gl/pN5fQ
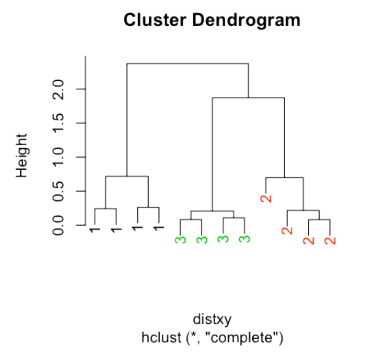
三、Hierarchical Clustering
dist() - This function computes and returns the distance matrix computed by using the specified distance measure to compute the distances between the rows of a data matrix.
|
1 2 3 4 |
dataFrame <- data.frame(x=x,y=y) distxy <- dist(dataFrame) hClustering <- hclust(distxy) plot(hClustering) |
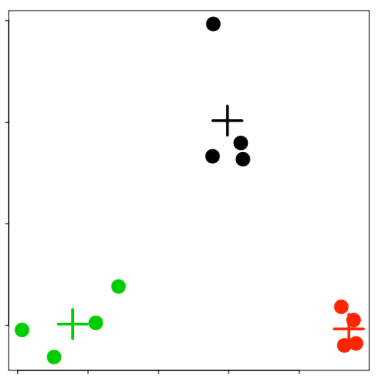
四、K-means Clustering
kmeans() - Perform k-means clustering on a data matrix.
|
1 2 3 |
dataFrame <- data.frame(x,y) kmeansObj <- kmeans(dataFrame,centers=3) names(kmeansObj) |
|
1 2 |
[1] "cluster" "centers" "totss" "withinss" [5] "tot.withinss" "betweenss" "size" |
|
1 |
kmeansObj$cluster |
|
1 |
[1] 3 3 3 3 1 1 1 1 2 2 2 2 |
|
1 2 3 |
par(mar=rep(0.2,4)) plot(x,y,col=kmeansObj$cluster,pch=19,cex=2) points(kmeansObj$centers,col=1:3,pch=3,cex=3,lwd=3) |
五、Dimension Reduction
This part seems harder to understand than any other part...
Speak Your Mind